Radio frequency radiation
1979 – present day
In 1975, the US Environmental Protection Agency (EPA) began measuring radiofrequency radiation in 15 American cities. This work was summarised in a final report in 1986 which shows that, in most cases, radiation levels were significantly lower than they are today.1
Explanations can be found under the question mark at the bottom right.
With a median value of 200 microwatts per square metre, Portland had the highest reading, while Chicago and San Francisco had the lowest reading of 20 microwatts per square metre. A similar measurement conducted by the Swedish Radiation Safety Authority in 2012 showed 16 microwatts per square metre in rural areas and 270 in cities.2 Radiation levels in rural Sweden are now approaching those in the cities included in the American study. In the table below, 'microwatts per square metre' is abbreviated to µW/m² and 'median value' means that the number of people exposed to radiation weaker than the median value was equal to the number of people exposed to radiation stronger than the median value.
Table 1. US cities, Public exposure3 |
||
|---|---|---|
| City | Median
value |
Per cent of population exposed to more than |
| Boston | 180 | 1,5 |
| Atlanta | 160 | 0,8 |
| Miami | 70 | 1,8 |
| Philadelphia | 70 | 0,13 |
| New York | 22 | 0,4 |
| Chicago | 20 | 0,4 |
| Washington | 90 | 2,8 |
| Las Vegas | 120 | 0,9 |
| San Diego | 100 | 0,15 |
| Portland | 200 | 0,3 |
| Houston | 110 | 0,01 |
| Los Angeles | 48 | 0,1 |
| Denver | 74 | 0,15 |
| Seattle | 71 | 0,19 |
| San Francisco | 20 | 2,34 |
| Mean for all cities | 48 | 0,56 |
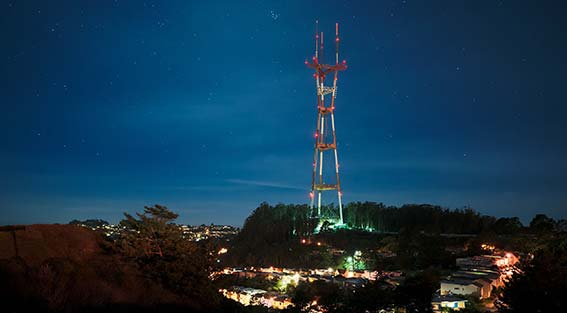
Even in 1979, some people were living in areas with much stronger radiation than most others. The right-hand column shows the percentage of the population in each city exposed to radiofrequency radiation exceeding 10,000 microwatts per square metre. Washington, D.C. had the highest percentage, at 2.8 people per 100 inhabitants. San Francisco had the second-highest percentage, at 2.34 people per 100, and the lowest median value, at 20 microwatts per square metre. This is because in the middle of San Francisco, on the 254-metre-high Mount Sutro, stands Sutro Tower: a 297-metre-high mast bearing several TV, radio and communications antennas. Strong radiation affects those who live near the mast.
The top antennas are located 552 metres above sea level and emit the strongest radio waves horizontally in all directions. These waves hit people living at high elevations in San Francisco, resulting in a large proportion of highly exposed residents. However, as the antennas are so high above the surrounding land, the radiation mostly passes high above the heads of residents, resulting in a low median value.
Even extreme locations where people spend time were not forgotten. Radio and television masts on the roofs of tall buildings created extremely strong radiofrequency radiation on the top floors and in nearby buildings. Measurements taken on the top floors of surrounding buildings revealed power densities of up to 970,000 microwatts per square metre.4

The spire-like structure at the top of the Empire State Building in New York houses radio and TV transmitters. In 1978, 307,000 microwatts per square metre were measured from the FM radio transmitters at the top of the building in the observatory for tourists on the 102nd floor and by the windows.5 This is a level that mobile phone masts in Sweden can reach. The Swedish Radiation Safety Authority measured 410,000 microwatts per square metre in one apartment's living room and 190,000 microwatts per square metre in its bedroom. The apartment overlooked a mobile phone mast located at the same height as the apartment, but on the roof of the neighbouring building.6 This is what happens when radio transmitters are placed among people.
Around 1979, extremely high levels of radiofrequency radiation, amounting to hundreds of thousands of microwatts per square metre, were found around radio and television masts, with FM radio being the main contributor. In the large cities included in the EPA study, 85 out of 100 Americans lived in residential areas with radiation levels below 300 microwatts per square metre, and 50 out of 100 lived in areas with levels below 20 microwatts per square metre in the 15 cities.7 Today, this seems like a dream.
Most of the radiation in the late 1970s came from FM radio
because that technology had the most transmitters, which
were positioned lower down.10 Today, mobile
telephony has taken over that role, with even more
transmitters and antennas positioned as low as the walls of
buildings.
Since 2012, the Swedish Radiation Protection Authority has conducted the same survey in the municipalities of Solna and Sundbyberg in the outskirts of Stockholm, measuring FM radio, television and mobile phone signals using an antenna mounted on a car roof. As the measurements were not taken every year, there are gaps in the graph below showing the results.8 A yellow line has been added for comparison, showing the median value of 480 microwatts per square metre for all 15 American cities, see Table 1. In 2024, the median value in Solna and Sundbyberg was 2,660 microwatts per square metre, while the highest mean value was 6,700 microwatts per square metre in 2022.

The United States Environmental Protection Agency undertook an ambitious project involving taking measurements at numerous sites in urban areas and using 1970 census data to estimate the number of people exposed to various levels of radiofrequency radiation in residential areas. This study was unique and has never been repeated.
Technical data
Environmental Protection Agency 1979
The following frequency ranges were measured:
TV within 54-88 MHz, 174-216 MHz och
470-806 MHz,
FM-radio 88-108 MHz,
land-mobile radio 150-162 MHz and 450-470 MHz.
The 450–470 MHz frequency range is familiar to people in northern countries as it was used for the NMT 450 mobile phone system, which was launched in 1983. But was mobile telephony available in the United States in 1979? No — it also began in 1983 within the 869–894 MHz frequency range. The last two measurements were conducted by the United States Environmental Protection Agency in 1984 and 1985, but these concerned FM radio. Therefore, no modern mobile telephony was included in the measurements.
Swedish Radiation Protection Authority 2024
The measurements cover radiofrequency radiation within the 30–4,200 MHz frequency range.
The 18-kilometre route, driven at 36 kilometres per hour
(22,4 miles per hour) through Sundbyberg and Solna, saves
measurement data every second as a mean value from the
previous four tenths of a second. The same route has been
driven at roughly the same time of year.
Median or mean value?
The same data can be presented in two ways. The difference is that a small number of high values can raise the mean value without being representative of the whole. This can be seen in the annual measurements of the Swedish Radiation Safety Authority in Sundbyberg and Solna. In 2022, the the median value was 2,400 microwatts per square metre, while the mean value was 6,700 microwatts per square metre. This indicates that, at certain points during the car journey, the intensity of radiofrequency radiation were well above 6,700 microwatts per square metre.
